
One of the most important feature of LogView++ is certainly the Log Plot. Since the first version of LogView++, it has been the main function of LogView++. The concept of log plotting is basically very simple.. A log plot should contain following data:
- log asci data (las or asci file)
- completion package
- lithology package
- plot template, and
- well top
All of those data should be managed outside of log plot panel.. Log asci data should be conditioned in the log editor panel. Completion package is editable in the completion editor. Lithology package is also editable in Lithology editor. Template is a complicated data that must be managed in template editor. Meanwhile well top should also be managed in the zone editor. Once every data is ready, log plot panel should be able to use the data to create plot.
Creating Log Plot
Make sure to select MD or TVD mode for depth scale. After that, select well name exists in the project. Once well has been selected, available log data will be listed in log data combo box. Lithology and completion package will also be listed in the following combo box. Select those three data if available. At least one data must be exists to make sure that plot will be generated. After that, by selecting a template, the log plot will be filled with generated bitmap. To show zone in the plot, check well top available in the list.
Changing Plot View
The plot can be modified by changing the global scale value, using custom depth or zooming.. Increasing the scale will reduce the height of the plot. Changing the scale should be followed by refreshing the plot since it need to regenerate the bitmap. This scale value is actually a property of template. So, changing the global scale will temporarily overwrite the scale value of the template but not saved in the template. Using a custom depth will limit the viewer to plot only the interval of selected depth. Since it will regenerate the bitmap, you also need to click refresh button to update the plot after selecting custom depth. Zooming in and out will only change the size of view, but not the bitmap of plot itself.
Exporting Plot
For further usage, some people probably need to make a screenshot of the plot to open it in a image viewer, or included it into a report file or something else. The easiest way to do that is by exporting the plot to a bitmap file. by clicking the button export plot you will be prompted with saving file dialog. Fill the file name and click ok.
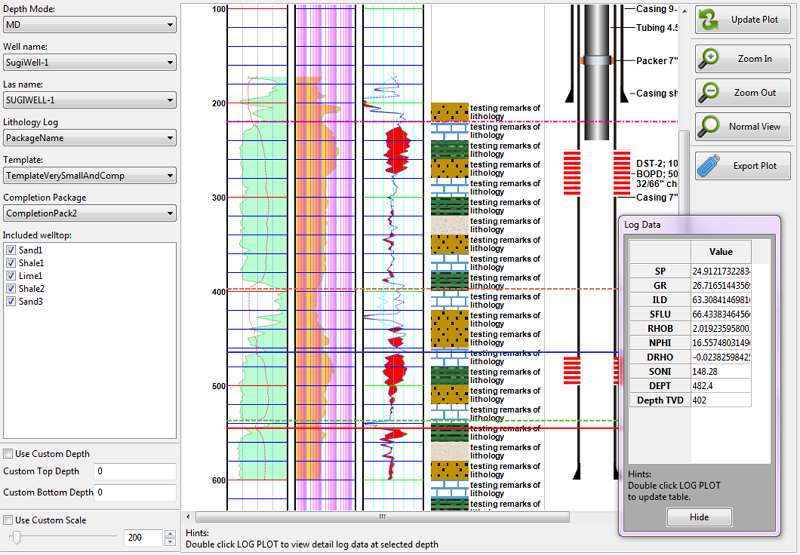
Viewing Detail LogData from Plot
At normal zoom mode, you can read the depth of the plot by hovering the mouse over the plot. The depth will be shown in the status bar. For further detail Log data, you can double click the plot. A dialog will be prompted to show the detail data at double-clicked depth.
Edit Well Top from Plot
Log Plot panel is also usefull to directly edit the well top penetrated by the well. By dragging the well top to a certain depth will automatically change the depth of well top and also overwrite the data of well top in the Zone Editor panel.
Can we print the log as PDF. Or hard copy
Logview is a great program. My only criticism is the fact that there is no way to enter the elevation of the well. What is usually called top of casing or Kelly bushing. Withouth that well correlation is almost impossible. other than that it is a great and useful software.