In this tutorial, I will show how simple is IstiChartLib for making simple plot.
Generally, the library consist of 6 Classes:
- istiChartAxis, for customizing axis
- istiChartLegend, for customizing the legend
- istiChartMarker, for customizing chart series marker
- istiChartPanel, panel for plotting the chart
- istiChartSeries, series of data to be plotted, and
- istiChartXY, the chart itself
For making simple chart, we dont have to deal with all of them. Simply use the istiChartPanel. Please see the following Test1 sample in IstiChartDemo code:
1 istiChartPanel *chart1 = new istiChartPanel(pnlCommonXY);
2 wxBoxSizer *box1 = new wxBoxSizer(wxHORIZONTAL);
3 box1->Add(chart1, 1, wxEXPAND);
4 pnlCommonXY->SetSizer(box1);
5 chart1->GetChart().SetTitle(“Common XY Chart Demo”);
6 for (int x = 0; x < 20; x++) {
7 istiChartSeries seri(“Chart-” + toString(x+1, -1));
8 VectorDouble VX, VY;
9 for (int i = 0; i <= 1000; i++) {
10 VX.push_back((double)i/10); //Data X
11 VY.push_back((x+1)*sin((double)i/10.0/(x+5)*PHI)); //Data Y
12 }
13 seri.SetData(VX, VY);
14 chart1->GetChart().AddSeries(seri);
15 }
16 chart1->GetChart().GetLegend()->SetMaximumColumn(2);
17 chart1->Update();
line 1-4: It is making istiChartPanel as a child of pnlCommonXY. It is actualy as simple as wxPanel in general. Don’t be bothered with pnlCommonXY. It can be any wxPanel or even your main wxFrame.
Line 5: Create the title of the chart
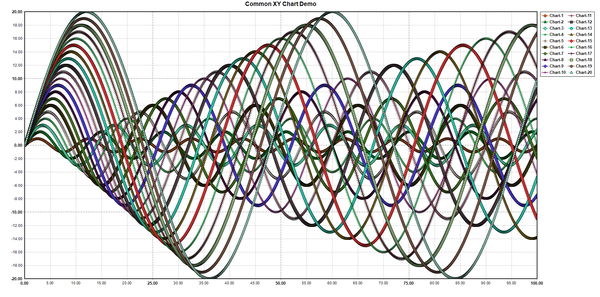
Line 6-15: It is used to make 20 chart series and adding the series to the chart. Each series has 1000 data of X and Y that is stored in VectorDouble VX and VY which is actually similar to vector<double> in std C++ library.
Line 16: Make the legend to have 2 column
Line 17: Draw the chart.
If nothing wrongs occur, the result should be like this:

Written by: Sugiyanto Suwono
Januari 26, 2016

Great work there!
i need to create a chart with x column having a double while y having dates?
Please give me an idea on the values of VX and VY
thanks!