
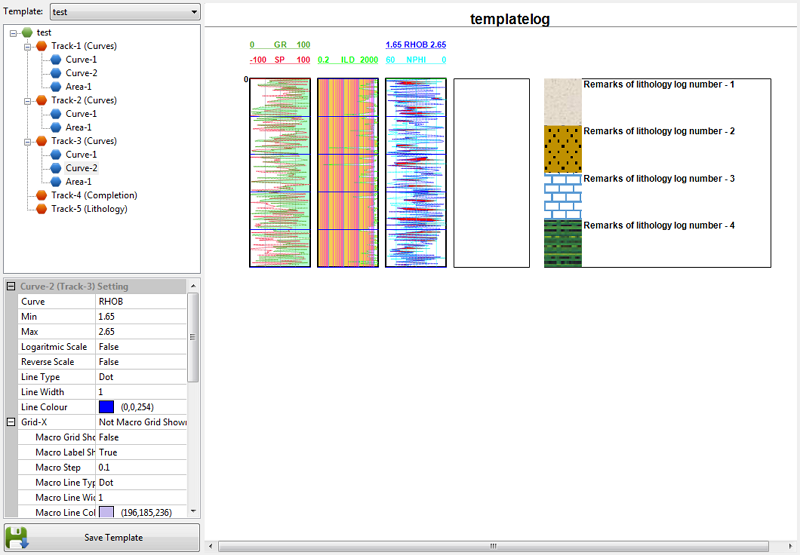
Template is a complex document that is very important to make a plot or cross section. The document of template should contain several properties depend on the number of track, number of curve on each track, and number of area on each track. Following picture is the screenshot of template editor. Every template can be modified in this template editor. Template is actualy text file. So basically if you don’t like with Template Editor, you can manually edit a template by using text editor and then import in to LogView++. However, if you are not sure what you are doing, it is strictly recommended to edit template inside the template editor rather than in a text editor.
Create New Template
Before we can customize a template, of course we have to create a template first. To do that, go to menu “Log Template” and Click new template.. Done. A default template should now be ready of the main LogView++ project tree.

Import Template
To import a template, in the menu “Log Template” click import. Browse an appropriate template file and click Ok. If template is valid, the imported template should now be ready in the project.
Export Template
Still in menu “Log Template”, click Export, select template in the prompted dialog and click OK. Fill the file name and click Save in the file dialog to export the file.
Delete Template
To remove a template from project, go to main LogView++ project tree, right click the template and click delete. Click yes in the confirmation dialog and template will be deleted.
Rename Template
To rename a template from project, go to main LogView++ project tree, right click the template and click setting. Type the new name and click ok to update the name.
Editing Template Properties
Go To Template editor select template you want to edit. Tree of template content should now be generated in the left part of Template Editor Panel.
Adding New Track
Right click the template name in the Template Tree and click Add Track. There are 3 kind of track available in LogView++ 2014; Curve Track, Completion Track, and Lithology Track. Curve Track can only be used to draw curve from log data. Completion Track is a place for drawing completion data. Meanwhile Lithology track is only able to handle the lithology data. After adding the track, you will see an empty track now available for editing.

Removing Track
Track can be removed by right-clicking the track in the template tree and click Delete Track

Adding Curve to a Curve Track
Right click the track and click Add New Curve.
Remove Curve
Right click the curve and click Delete.
Add Area
Right click the track and click Add New Area.
Remove Area
Right click the area and click Delete.
Editing Property Value
Every template data, Track, Curve, Area, or Template itself have many unique properties that will be used in log plotting.
Properties of Template
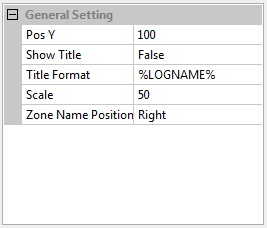
- Pos Y
It is the Y position of the plot. Pos Y is calculated from the top position. So the higher the Pos Y the lower the position of the plot. - Show Title
It is the choice whether you will show the plot title or not. - Title Format It is the format of the plot title. There are constant format that you can use for plotting specific data in LogView++ such as:
Code Usage %WELLNAME% To show the well name %LOGNAME% To show the log name %LITHONAME% To show the lithology package name %COMPNAME% To show the completion package name Other than that, the text will be directly plotted.
Example:
MyWell:%WELLNAME%
Will be printed as:
MyWell:SUGI_WELL1
In which SUGI_WELL1 is my real well name. - Scale
It is the scale of the plot. The bigger the scale the shorter the plot. - Zone Name Position
There are 2 places of zone name to plot. In the right or left.
Properties of Track
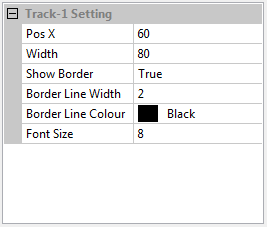
- Pos X
It is the X position of the track. X position is calculated from the left side of the plot. Higher value of X position the track will be plotted more right. - Width
It is the width of track. - Show Border
It is the option whether the border will be shown or not. - Border Line Width
It means the thickness of the border line. - Border Line Colour
It means the color that will be used for border. - Font Size
It is the size of the font, especially for drawing its label - Width of Well (only available for completion track)
Completion track will be divided into two column, the well column and label column. The width of well will be used to draw the well completion. The rest of (Width-Width of Well) will be used to draw the label. If Width of Well >= Width then label won’t be drawn. - Width of Lithology (only available for lithology track)
Lithology track will also be divided into two column, the lithology column and label column. The width of lithology will be used to draw the lithology data. The rest of (Width-Width of Lithology) will be used to draw the label. If Width of Lithology >= Width then label won’t be drawn.
Properties of Curve
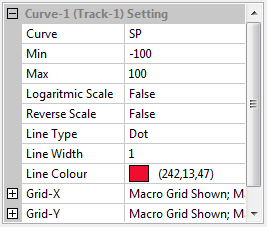
- Curve
It is the name of the curve to be plotted. The name of the curve have to be EXACTLY SIMILAR to the name of column in the log data. - Min
It is the minimum scale of the curve. Any log value below minimum value will be plotted outside the track or technically ignored. - Max
It is the maximum scale of the curve. Any log value above maximum value will be plotted outside the track or technically ignored. - Logaritmic Scale
If the value is true, the curve will be drawn in logaritmic. Otherwise, the curve will be plotted in linier scale. - Reverse Scale
In normal mode, the minimum scale would be in the left and maximum in the right position. For reverse mode, it would be in the backward position. - Line Type
The line type could be SOLID, DOT, SHORT DASH, LONG DASH, or DOT & DASH. - Line Width
It is the thickness of the curve line. - Line Colour
It is the color of the curve line. - Grid-X and Grid-Y
Grid X and Y properties will control the gridding process in the track. However, it is a part of curve property. So, in one track we can create more than one grid types. Grid-X will control grid in X direction (curve scale), while Grid-Y will control the Y direction (depth scale). Every grid consist of Macro and Micro grid. The Macro should have larger steps than the micro.- Macro Grid Shown
It is the option whether to show the macro grid or not. - Macro Label Shown
It is the option whether to show the macro grid label or not. - Macro Step
It is the stepping value of Macro grid. - Macro Line Type
It is the line type of Macro grid. It could be SOLID, DOT, SHORT DASH, LONG DASH, or DOT & DASH. - Macro Line Width
It is the thickness of the Macro grid. - Macro Line Colour
It is the Macro grid line color. - Micro Grid Shown
It is the option whether to show the micro grid or not. - Micro Label Shown
It is the option whether to show the micro grid label or not. - Micro Step
It is the stepping value of Micro grid. - Micro Line Type
It is the line type of Micro grid. It could be SOLID, DOT, SHORT DASH, LONG DASH, or DOT & DASH. - Micro Line Width
It is the thickness of the Micro grid. - Micro Line Colour
It is the Micro grid line color.
- Macro Grid Shown
Properties of Area

- Curve Left
It is the name of curve as left border of the area. The curve name must be EXACTLY SIMILAR to the column name in the log data. if you want to plot area from the left border instead of a curve, use $LEFT_BORDER. - Curve Right
It is the name of curve as right border of the area. the curve name must be EXACTLY SIMILAR to the column name in the log data. If you want to plot area to the right border instead of a curve, use $RIGHT_BORDER. - Fill Colour
It is the fill color that will be used to draw the area.
Saving Edited Template
Before edited template could be used for any plot, the template must be saved first. To do that, click the button “Save Template” in the bottom part of the template editor. Or, if you accidentally open another panel, a saving dialog confirmation will be prompted. just click Yes to save it.
Natural Gas Engineering student from Texas, capstone design project:
Well logs will not publish from the template editor to the log plot. I set tracks and areas, yet I only get two logs, and none of the others show up even if I edit the templates. What are your thoughts? Please help, we are relying on this software! Thank you for doing what you do.
-Wayne
Hi Wayne,
There are some possibilities: 1) may be the curve name you’ve put in the template does not match with the curve name (column name) in the las file. To resolve that, in template editor, in the tree, click the curve-1, edit property of “Curve / Group”, and make sure to select a curve name that match to your las. 2) may be the scale is not in the range 3) may be you are using regional setting in your pc that uses “,” comma for decimal. If that so, try to change to use “English US” in your pc and restart the LogView++.
Is there any way to plot depth track with labels in the template editor?
Unfortunately it is still not possible to make a dedicated track for depth data.
Depth plot will always attached to curve in a certain track if enabled.
Anyway, i will consider this as input for future release. Thank you.