
Cross section generally is a comparison of many log plot in a single viewer. It mostly used for correlation of zone penetrated by wells in order to understand the stratigraphic view of an oil and gas reservoir. So, to build a cross section, every well log plot must be generated. However, you don’t have to go to log plot panel since the cross section panel can handle everything by itself. However, some advance feature like editing zone and viewing data of log from log plot still unsupported in cross section panel.

Add New Plot
To create a plot in cross section panel, go to “Well Plot” tab in the left part of cross section panel and click button (+). The following dialog will be prompted. Fill up all properties of the plot i.e. the name to the plot (only used for identifier, no effect to plot), depth mode whether TVD or MD Select the well to be plotted and also its log data, lithology package, and completion package. You also have to select the template to be used for plot. To plot only a certain depth, check “Use Custom Depth” and fill out the top and bottom depth.

Edit Existing Plot
If you made a mistake when creating a plot, you still can edit the plot by clicking button (…) in the “Well Plot” Tab. A similar dialog will also be shown up. Edit it and click OK to update.
Changing Order of Plot
The order of plotting in cross section from left to right is determined by the order of plot name in the plot list. To move to the right, click button “Down” while move to left by clicking button “Up”.
Delete Existing Plot
To delete the existing plot, click button (x) and confirm the deletion dialog.

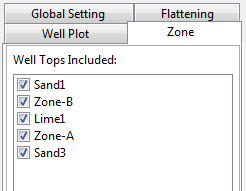
Select Zone to Show
Zone is one of the most important thing in cross section. To show or hide the zone, you can simply check or uncheck the zone list in the “Zone” tab.
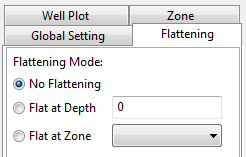
Choose Flattening Mode
Flattening mode is very important in correlating plots. In most cases, using TVD mode and flatten to contact or a zone is recommended to compare the plot. However, LogView++ give you freedom to choose the flattening mode whether no flatten, use depth, or use zone. No flattening means every plot will be plotted as it is based on the data available in the plot (either las, lithology, its completion, or its custom depth). Flatten to depth means that t selected depth, the plot will be equal in position. While flatten to zone means that cross section will equalize all plot at selected zone in every well. In case of no zone available in a plot or well, the plot will be drawn from zero position at top of cross section position.
Use Global Setting
In case of you have created several plot in cross section but each plot have a different setting especially depth mode, Template, custom depth; you can force every plot to use a same setting using global setting. To do that, go to “Global Setting” panel and change the global depth mode, global template, and global custom depth. You can even change the scale of log by checking “Use Custom Scale” and fill the value of custom scale. After that click “update Plot” button in the right part of the cross section panel.
Changing Cross Section View
The plot can be modified by zooming.. Zooming in and out will only change the size of view, but not the bitmap of plot itself. So, just click button Zoom in or Zoom out in the right part of the cross section panel and everything should be done.
Exporting Cross Section
For further usage, some people probably need to make a screenshot of the plot to open it in a image viewer, or included it into a report file or something else. The easiest way to do that is by exporting the plot to a bitmap file. by clicking the button export plot you will be prompted with saving file dialog. Fill the file name and click ok.
Is this site still maintained? Download links direct to phishing sites.
Yes, it is still being maintained although not so frequent.
You can try the download link again, and don’t forget to wait for 5 seconds before the “Skip Ad” button to show up in the right-top most corner. Click that button to download.
seems interesting but the download link only leads to junk site. Is it real?
Yes, It is real.. I have recently updated the link. Please try again, and don’t forget to wait for 5 seconds before the “Skip Ad” button to show up in the right-top most corner. Click that button to download.
Oh yes it is. I have downloaded it and have been using it for academic purpose from past 2 months
This is the excellent free software and work best for me as Wellsite/Operations Geologist. It is very user friendly and fulfill all Well log correlation requirement. I just want to add another feature as creation of Well location map which can be only a 1D window displaying the well location from the co ordinates.
Thank you so much Shams for your input. I definitely will consider it to be added to LogView++ in the future release.
@Firagiel ,, great job you have done, very useful for different professionals. I was looking to add WITS reception in real time with data from different tools, is that possible?, if not, it will be a wonderful improvement for the near future..!! Thanks a lot
Exelente softwar, very easy to use and great curve of apprehension, we miss the creation of a well map, but we hope soon incorporate it.
I have a problem when using cross section some times the depth scale is not shown at all